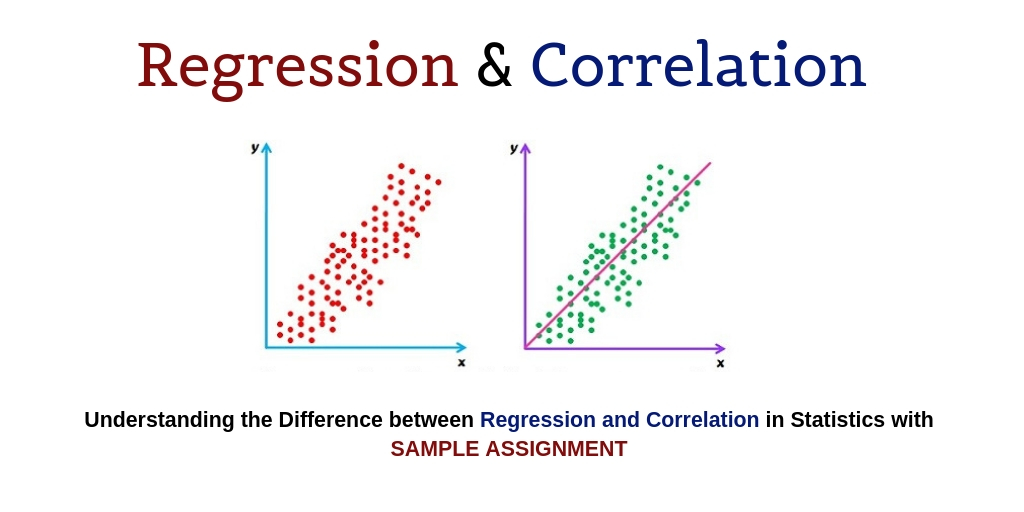
Correlation V/S Regression
As a statistics student, you might have often come across these two terms. But for those who haven’t, these two terms are basically the types of analysis that are based on multivariate distribution. Now to tell you what multivariate means, it actually stands for the distribution of more than variable. According to the experts of our statistics assignment writing services, correlation and regression are the most vital concepts in statistics when it comes to analysing data efficiently. Now, coming to these terms,Correlation
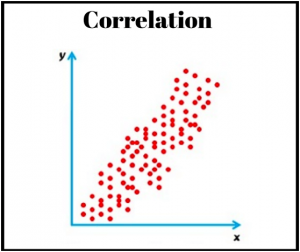 Correlation is the type of analysis where you get to know the relationship between two variables (x and y). When you carry out this type of analysis, you get to know much absent or associated the variables are with each other. As you can see in the image made by our statistics experts, there are two variables, namely x and y and when you talk about their relationship, you are automatically applying correlation in statistics.
Types of correlation
The nature of the data to be analysed is dynamic and changes over time. Thus, based on the nature of the data, there are mainly 3 types of correlation-- Positive correlation- In cases, wherein both the given variables deviate in the same direction, the variable is said to show positive correlation. For instance, when the income increases, the expenditure too increases.
- Negative correlation- When both the given variables deviate in opposite directions, the variables are said to show negative correlation. For instance, when demand increases, the price also increases.
- Zero correlation- In the cases wherein, no variable is dependent on other, the variables are said to demonstrate zero correlation. For instance, the height of a student and his marks.
Methods of correlation
For finding correlation coefficient, our statistics assignment help experts make use of the following methods -- Karl Pearson’s method
- Spearman’s Rank method
- Least squares method
Regression
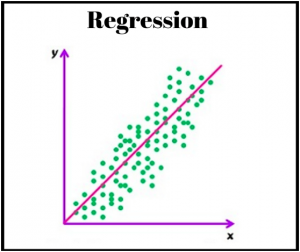 In this type of analysis, you get to predict the value of one variable which is dependent on the independent variable. The experts of statistics assignment writing services do this by assuming the average mathematical relationship between the given variables.
Types of regression
Based on the functionality, our statistics assignment experts classify two types of regressions -- Simple linear regression- This is a type of statistical method through which you would be able to summarise and study how two continuous variables are connected to each other.
- Multiple linear regression- With the help of this method, you can easily examine the linear relationship between variables.
CORRELATION |
REGRESSION |
| Purpose- To predict about the most dependable forecasts. | Purpose- To predict the unknown variable based on the value of the known variable. |
| Scope is limited | Scope is wider |
| The variables here are dependent to each other. | Here, one variable is dependent and the other is independent. |
| Change of origin or scale does not affect correlation coefficient. | Change of origin does not affect this, but scale does. |
| The coefficient is mutual and symmetrical | This is not symmetrical |
| Coefficients range is from -1.00 to +1.00 | Byx>1, then byx<1 |
Place Your Order With Us, Now!
Sample Assignment is the game changer, even for those students who do not possess the complete knowledge about correlation and regression. Being one of its own kind, we are sure that our statistics assignment help experts have been successful in clearing all your doubts regarding this topic. For more information about other topics or subjects which we have written, refer to our blog section. Having a steadfast panel of assignment experts, who not only guide you on various subjects, but also provide reference solutions for the same, sky is the limit for us! Also, be it at midnight or early in the morning, our 24X7 assistance is available for you any time you need us. So, consult us via the order now form and start writing your flawless assignments, in no time! Recommended:Related Blogs


Get Quote In 2 Minutes*


Loved reading this Blog? Share your valuable thoughts in the comment section.
Add comment