Statistics is the science and practice of analysing and collecting numerical data in large quantities to infer proportions in a whole from those in a representative sample.
Inferential and Descriptive are two main categories of Statistics. To understand the difference between inferential and descriptive statistics, let us first get a grasp of what they mean individually.
What is Descriptive Statistics?
To describe the characteristics of a dataset, descriptive statistics are used. It is used to explain both the overall process of gathering insights and the quantitative observations. Descriptive statistics are explanatory and hence, used both for describing individual samples and groups or an entire population. Descriptive statistics makes use of central tendency, distribution, and variability to make the explanations. It uses descriptive coefficients to summarise any set of data. Basic tools of descriptive statistics are range, deviation, mode, median, mean, etc.
A few common topics that students are likely to work on might include density estimation using a kernel-smoothing function, percentile and quartile estimates, generalised bootstrap function, sample statistics by making use of the re-sampling technique.
What is Inferential Statistics?
Inferential statistics is a statistical procedure that is used to examine data. Inferential statistics are used to make inferences or conclusions about the processed data. Sampling variations, graphs, charts, observational errors, etc., derived from descriptive statistics, are studied through inferential statistics to make sense of the data.
The main objective of the tool is to give measurements that can be utilised to demonstrate a research project's overall population by taking a glance at its sample. It enables the researchers to make reasonably confident assertions related to the key elements. Some common types of inferential tools are R-squared analysis, Regression models, normal distributions, and so on. A small sample size can also define the variable's overall behaviour from the point of view of the entire population, allowing new ideas and hypotheses to emerge. You will see that Inferential statistics are widely used in terms of business organisations. Inferential statistics in research are brought by forecasting models. The statistical model takes into account a small set of data to forecast how variables are going to behave shortly based on historical data.
What are the Types of Inferential Statistics?
There are no types of inferential statistics but tests. These tests are tools that help us conclude. Some of the inferential statistics tests include:
- Regression analysis - Regression analysis is defined as a set of statistical procedures which is used to explain the connection between dependent variables and independent variables. One of the most common types of regression analysis is Linear regression, in which a person finds the line (or a more complicated linear combination) that best fits the data according to a set of mathematical criteria.
- Analysis of variance (ANOVA)
Analysis of variance (ANOVA) is a pool of statistical models and associated estimate processes (for example, "variation" among and between groups) that are used to assess variations in means. A statistician, Ronald Fisher, invented Analysis of variance or simply ANOVA. ANOVA is primarily based on the law of total variance. The Law of total variance divides observed variance in a variable into components attributed to several causes of variation. ANOVA, basically, is a statistical test that determines if two or more population means are equal and hence extends the t-test beyond two means.
- Analysis of covariance (or ANCOVA)
ANCOVA (analysis of covariance) is a linear model that combines ANOVA with regression. ANCOVA tests if the means of a dependent variable (DV) are equal across different levels of a categorical independent variable (IV), commonly referred to as a treatment. It also statistically controls the effects of other continuous variables that are not of main interest, known as nuisance variables or covariates (CV). The variance in the DV is mathematically decomposed into variance explained by the covariates, variance explained by the categorical IV, and residual variance. In a sense, ANCOVA can also be regarded as 'tuning' the DV using the CV group means (s).
- Statistical significance (t-test)
In insights, Welch's t-test, or inconsistent changes t-test, is a two-example area test that is utilized to test the theory that two populaces have equivalent means. It is named for its maker, Bernard Lewis Welch, is a variation of Student's t-test, and is more solid when the two examples have inconsistent differences as well as inconsistent example sizes. These tests are regularly alluded to as "unpaired" or "free examples" t-tests, as they are ordinarily applied when the factual units fundamental the two examples being looked at are non-covering. Considering that Welch's t-test has been less famous than Student's t-test and might be less recognizable to perusers, a more useful name is "Welch's inconsistent changes t-test" — or "inconsistent fluctuations t-test" for brevity.
- Correlation analysis
Any statistical link between two random variables or bivariate data, whether causal or not, is referred to as correlation or dependence in statistics. Correlation can apply to any statistical relationship, but it is most usually used to describe how closely two variables are related. Both the association between the price of an item and the quantity that consumers are willing to purchase, as depicted in the so-called demand curve and the link between the height of parents and their kids, are examples of dependent phenomena.
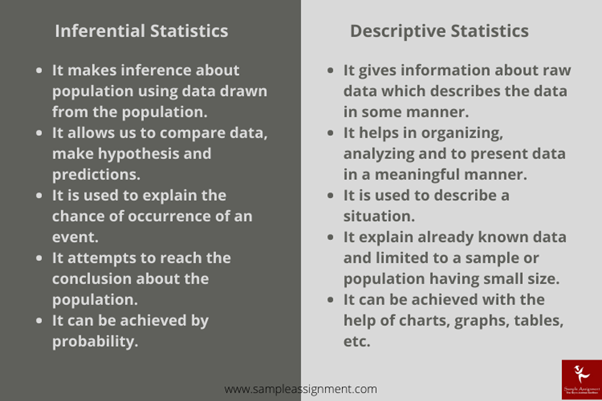
Inferential Vs Descriptive Statistics
The two major types of statistics are different yet dependent on each other. Mostly, inferential statistics come after descriptive statistics. The two exist together. The major differences between them are presented to you in this image:
Get academic writing help from the experts of Sample Assignment and score high distinction grades. There is no need to worry about the deadline or money since our services do not make a hole in your pockets, and we always deliver the assignment on time. We have the best pool of assignment writers who hold years of experience and expertise in relevant fields. We are available round the clock to provide you hassle-free service and to ensure timely delivery of your assignments.
Avail of our services today!


Get 50% OFF On Assignment Help


Loved reading this Blog? Share your valuable thoughts in the comment section.
Add comment